Abstract
Measurable residual disease (MRD) is a highly sensitive reflection of disease burden that correlates with time-to-event outcomes in chronic lymphocytic leukemia (CLL). Undetectable MRD at the end of fixed-duration treatment is an independent prognostic marker and associated with favourable progression-free and overall survival. Muti-colour flow cytometry (FC) is the most common method of MRD assessment and often performed using a harmonized protocol established by the European Research Initiative on CLL.
Conventional FC analysis involves sequential manual gating strategies performed on 2-dimensional scatter plots with varying axis parameters. While straightforward with a small number of parameters, this process becomes too complex and time-consuming with state-of-the-art mass flow cytometers where up to 40 markers are simultaneously measured and large multidimensional datasets are generated. Over the past decade, a variety of computational FC algorithms have been developed to automate and assist in tasks such as population identification, enumeration, and classification. These mathematical approaches are based on dimension reduction and clustering methods that require up to several hours and have not been compatible with routine diagnostic workflows until recently. Flow-Self Organizing Maps (FlowSOM) (Van Gassen et al. Cytometry A 2015) is an unsupervised clustering algorithm (R package from Bioconductor) with fast analysis times and multidimensional visualization. Implementation of FlowSOM in a diagnostic laboratory offers several advantages including lower technical variability, reduced bias, and improved efficiency.
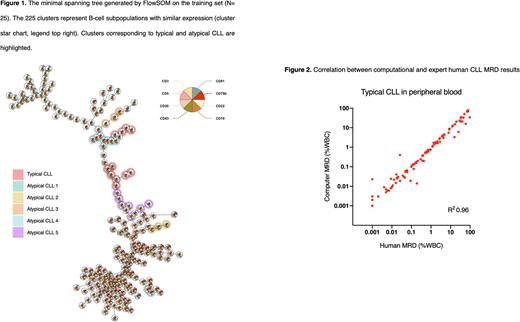
We developed a computational pipeline to assess CLL MRD using FlowSOM. CLL flow cytometry standard (FCS) files were identified from the Peter MacCallum Cancer Centre and included cases with typical and atypical immunophenotypes from peripheral blood (PB) or bone marrow (BM). Atypical CLL was defined as cases with different expression of one or more antigens from the typical immunophenotype. The diagnostic workflow was developed using a training set (n=25) containing representative samples from MRD negative (n=5), typical CLL (n=5), atypical CLL (n=10), and healthy bone marrow (n=5) cases. Computational accuracy was evaluated against expert human analysis in a validation cohort (n=293) consisting of PB typical (n=139), PB atypical (n=91), BM typical (n=30), and BM atypical CLL (n=33) samples. FCS files were preprocessed (PeacoQC, FlowCore R packages) to remove low-quality events, apply compensation, and transform the data prior to FlowSOM analysis. Two-level hierarchical clustering was performed to achieve maximum separation between normal and MRD events (level 1: lymphocytes, level 2: B cells). The training set was used to generate a diagnostic map of 225 clusters containing the full breadth of immature and mature B cells along with disease immunophenotypes (Figure 1). Clusters were verified by manual inspection in Kaluza software. Computational MRD was then determined by applying the FlowSOM map to validation samples and counting events within the disease clusters.
Computational MRD demonstrated excellent correlation with expert human analysis. Linear regression R2 was 0.96, 0.79, 0.96, and 0.91 for PB typical, PB atypical, BM typical, and BM atypical CLL cohorts, respectively (Figure 2). Positive or negative MRD was highly accurate using a threshold of 0.01% for MRD. Computational analysis demonstrated high sensitivity (99%, 99%, 100%, 90%), specificity (92%, 92%, 100%, 85%), and concordance (95%, 98%, 100%, 88%) across all four validation groups (PB typical, PB atypical, BM typical and BM atypical CLL, respectively). The kappa coefficient was 0.92 across the entire validation cohort. CLL MRD assessment in BM samples can be difficult due to overlapping immunophenotypes particularly between disease and transitional B cells. We subsequently included an additional BM cohort consisting of only MRD negative samples to further assess detectable/undetectable accuracy. Samples were highly concordant (94%) except for two cases with low disease signal (0.010% and 0.012%).
In summary, FlowSOM computational CLL MRD is highly accurate and offers the potential for an automated workflow. This method can be adapted to other haematological malignancies including acute leukemia and lymphoproliferative disorders.
Disclosures
No relevant conflicts of interest to declare.
Author notes
Asterisk with author names denotes non-ASH members.


This feature is available to Subscribers Only
Sign In or Create an Account Close Modal